- CFD, Fluid Flow, FEA, Heat/Mass Transfer
Analytical Calculations
Design Calculations
0-D and 1-D Calculations
Design Calculations in Mechanical Engineering
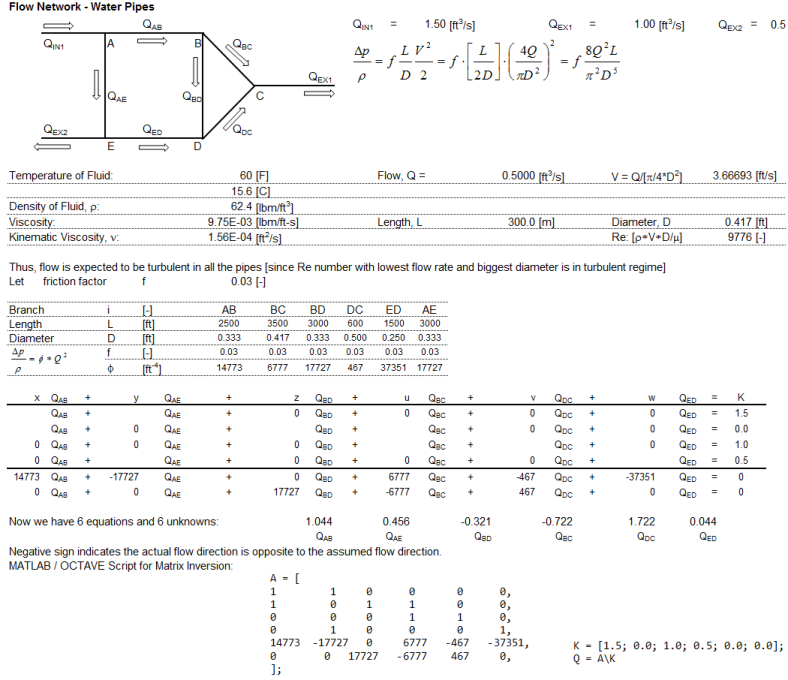
Design calculations related to automation of repeated task can be partially automated using spreadsheet applications such as Excel and matrix inversion tools [Excel or Octave]. These design calculations also help understand the method and acceptance criteria for preliminary design - before moving on detailed calculations.Psychrometry
Saturation pressure as a function of temperature: Ref: ASHRAE, input T in [K], output pSAT in [kPa]. Log in following formula refers to natural logarithm and not base of 10.
c1 = -5800.22, c2 = -5.51626, c3 = -0.0486402, c4 = 4.17648E-5, c5 = -1.44521E-8, c6 = 6.54597pSAT = e[c1 / T + c2 + c3 * T + c4 * T2 + c5 * T3 + c6 * Log(T)]
The dew point temperature based on TDEW = [Log(Pv / 610.78) * 241.88] / [17.558 - Log(Pv / 610.78)] where Pv in [Pa] is the vapour pressure of water in air.
Mixing of Moist Air Streams
User needs to validate the input. For example, if you refer any Psychrometric chart, the relative humidity line of 30% crosses specific humidity axis at 50 [°C] DBT. Similarly, relative humidity line up to 20% crosses specific humidity axis at 60 [°C] DBT. Hence, an input of 50% RH and 50 [°C] DBT is physically unrealistic.
| Field variables: | Unit | Stream-1 | Stream-2 |
| Volume flow rate - moist air: | [m3/hr] | ||
| Relative Humidity: | [%] | ||
| Dry Bulb Temperature: | [°C] | ||
| Saturation pressure: | [Pa] | ||
| Vapour pressure: | [Pa] | ||
| Humidity ratio (≈ Mass Fraction): | [g-vap/g-d.a.] | ||
| Specific enthalpy: | [J/kg-d.a.] | ||
| Mass flow rate - dry air: | [kg-d.a./s] | ||
| Mass flow rate - vapour: | [kg-vap/s] | ||
| Air (moist) properties after mixing | |||
| Mass flow rate (moist air): | [kg/s] | ||
| Specific enthalpy: | [J/kg-m.a.] | ||
| Humidity ratio: | [J/kg-d.a.] | ||
| Dry-bulb temperature: | [°C] | ||
| Relative humidity: | [%] | ||
How to read a psychrometric chart: As long as you have any 2 parameters where the lines will intersect, you can determine all other parameters. For example, if dry bulb temerature (DBT) and relative humidity (RH %) is known, draw a vertical line at the dry bulb temperature and let it intersect (cross) the curved line representing the RH value. The point where these two lines intersect is known as the state point. Once the state point is marked on the psychrometric chart, other parameters like humidity ratio, wet bulb, enthalpy, vapor pressure (note that partial pressure of water vapor = saturation vapor pressure) and dew point temperature can be read. Effective heating or cooling of air is the change in enthalpies at two state points. Be aware of the processes where moisture get added (say evaporative cooling such as chillers) or moisture get removed (say refrigerant cooling) from the air.
Few observations: The dew point lines traverse the chart as horizontal lines which indicates that dew point does not change as the dry bulb temperature varies. Vapor pressure lines also traverse the chart as horizontal lines which indicates that dew point and vapur pressure are two similar ways to denote a state point. Wet bulb temperature (WBT) lines are close to the specific enthalpy lines, they are not actually parallel to each other.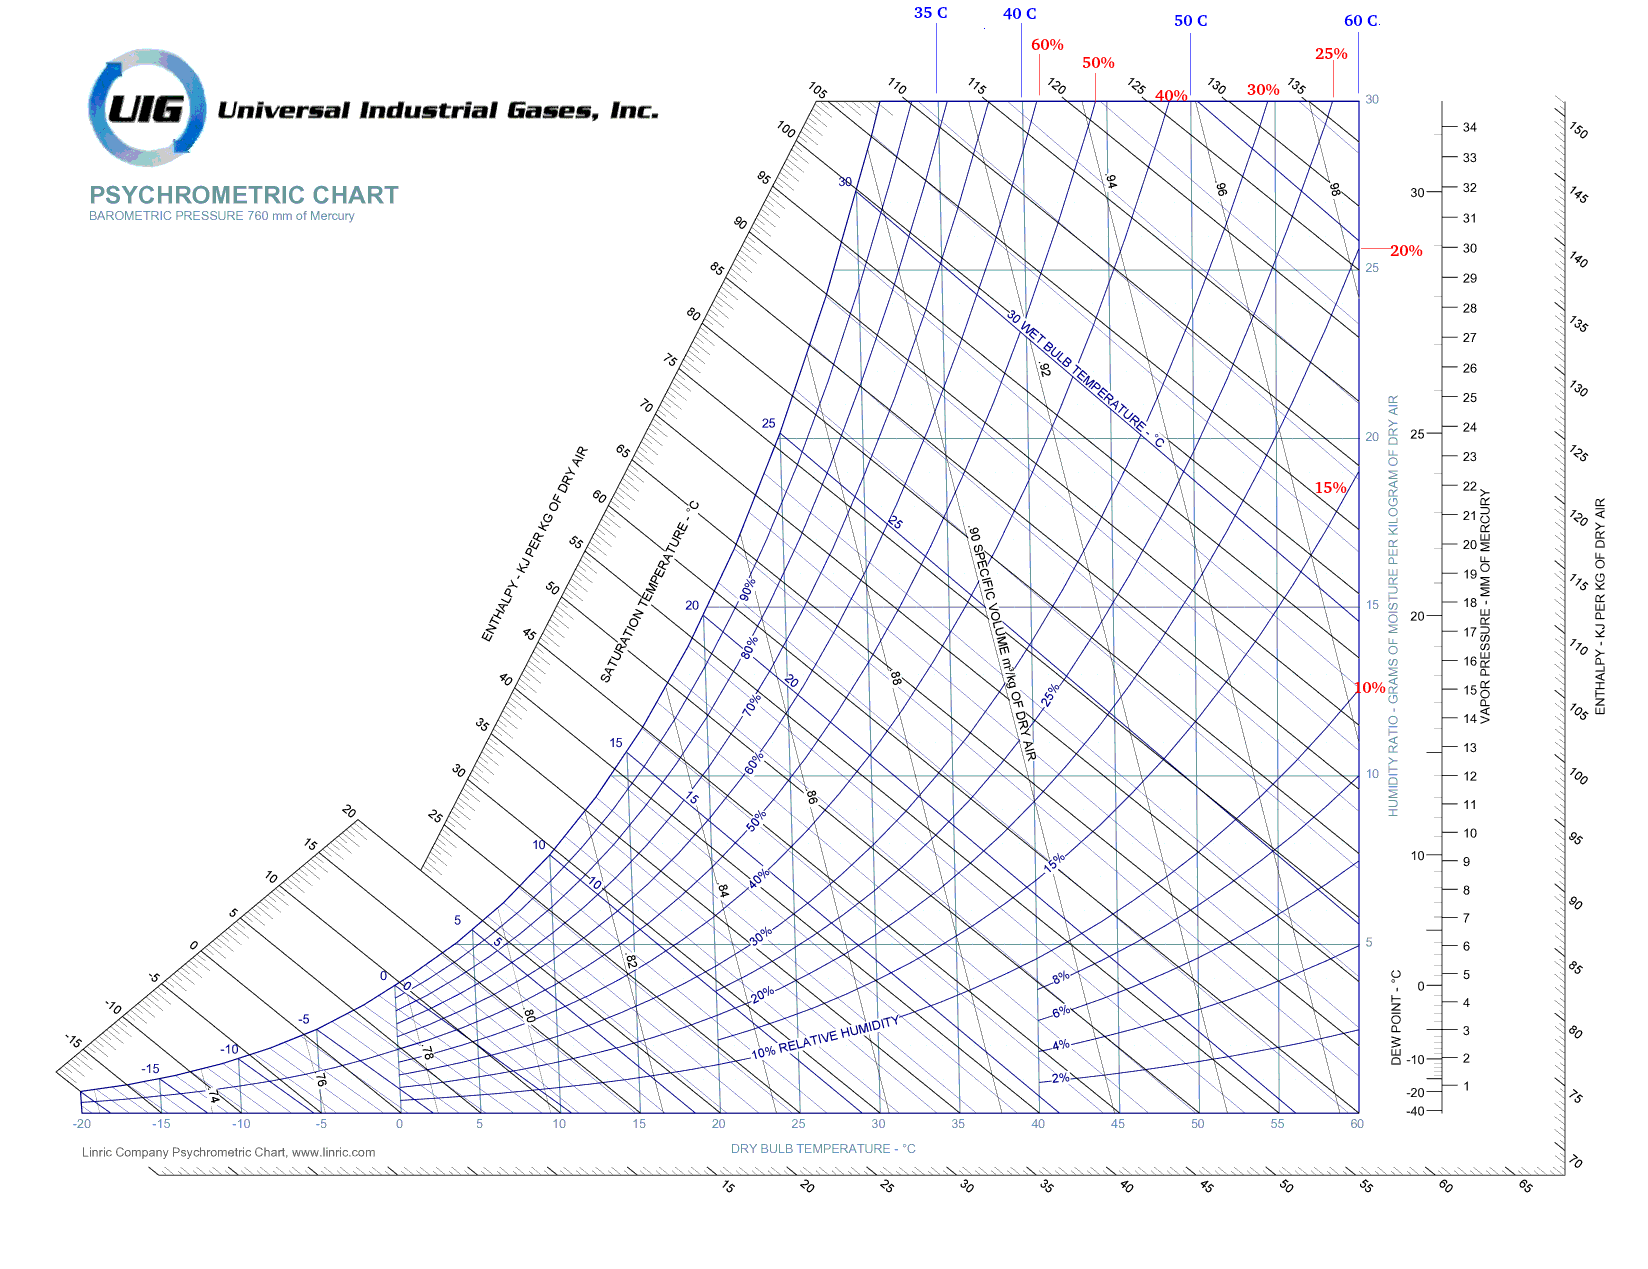
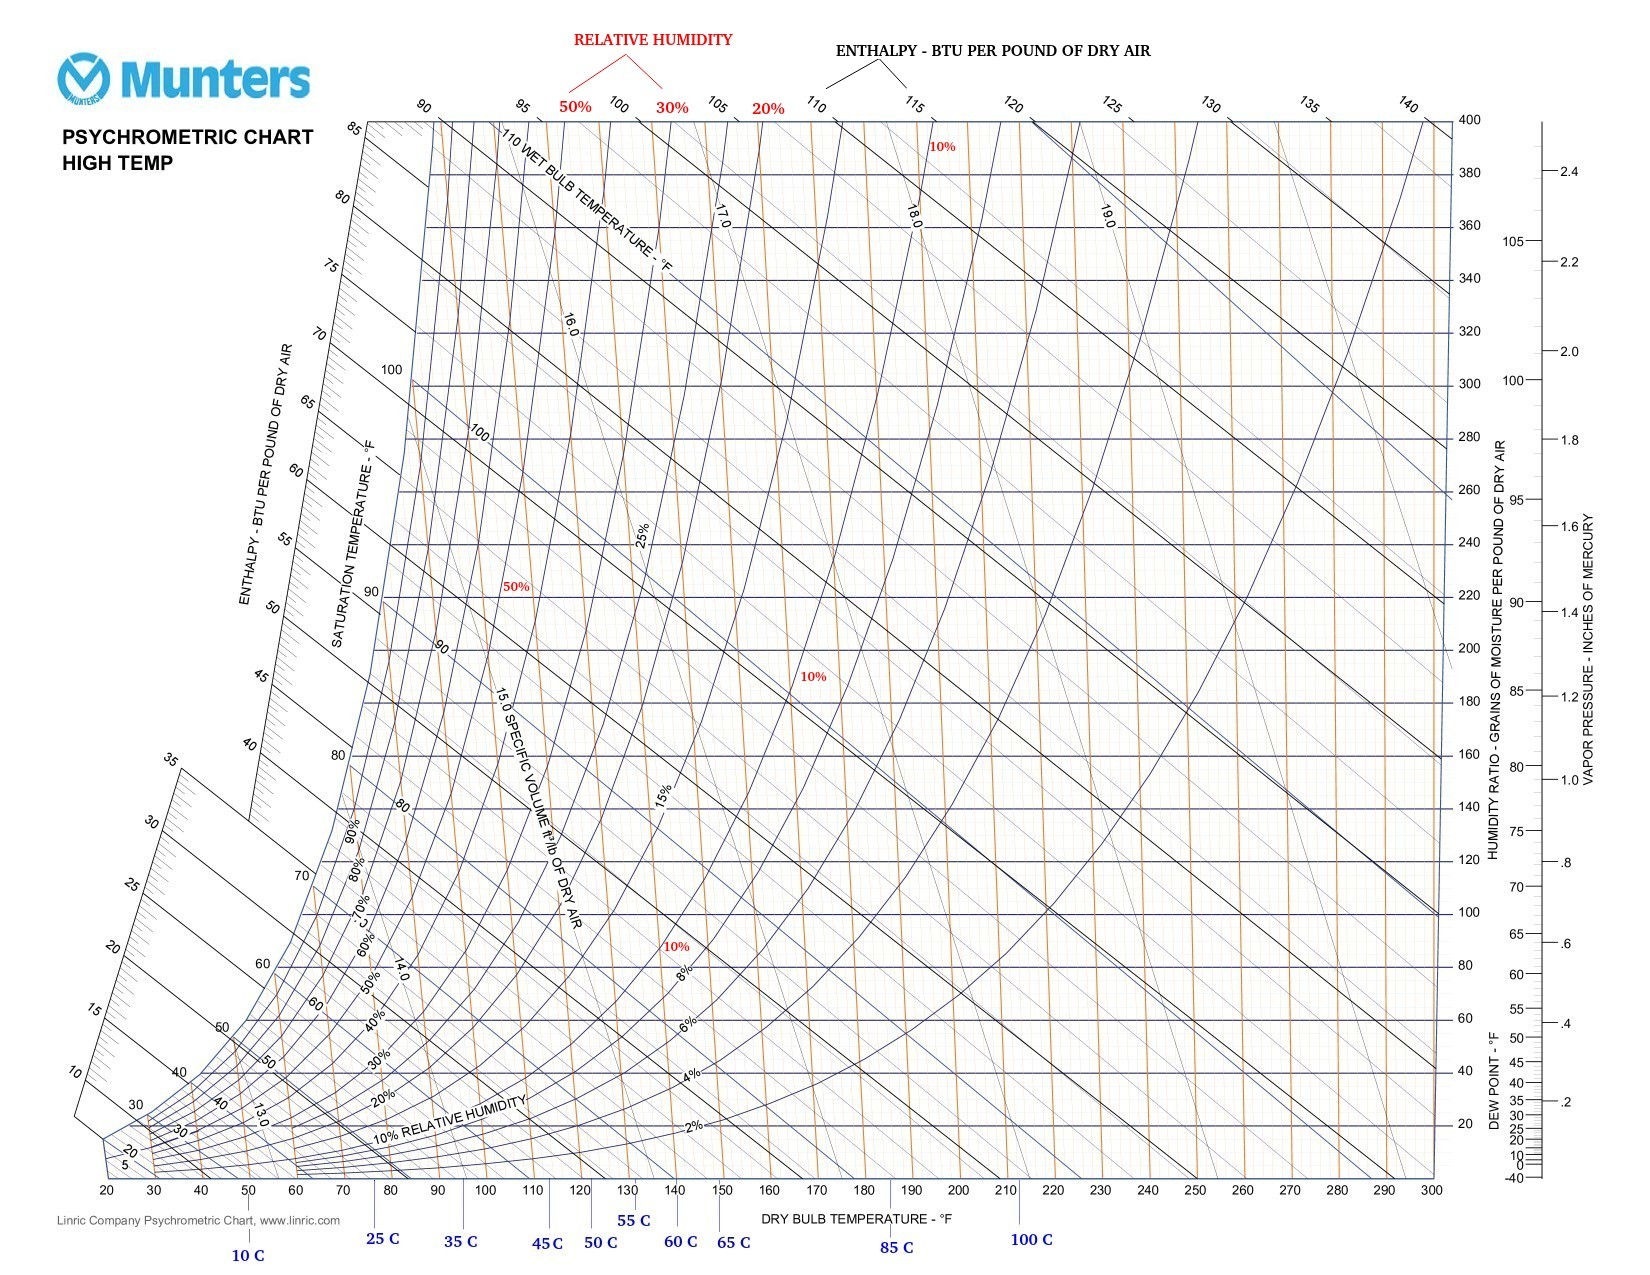
High Temperature Psychrometric Chart
Pipe Network
Go to top
HAVC - Basic
A lumped approach to estimate the required air flow rates for maintaining an enclosure under desired condition.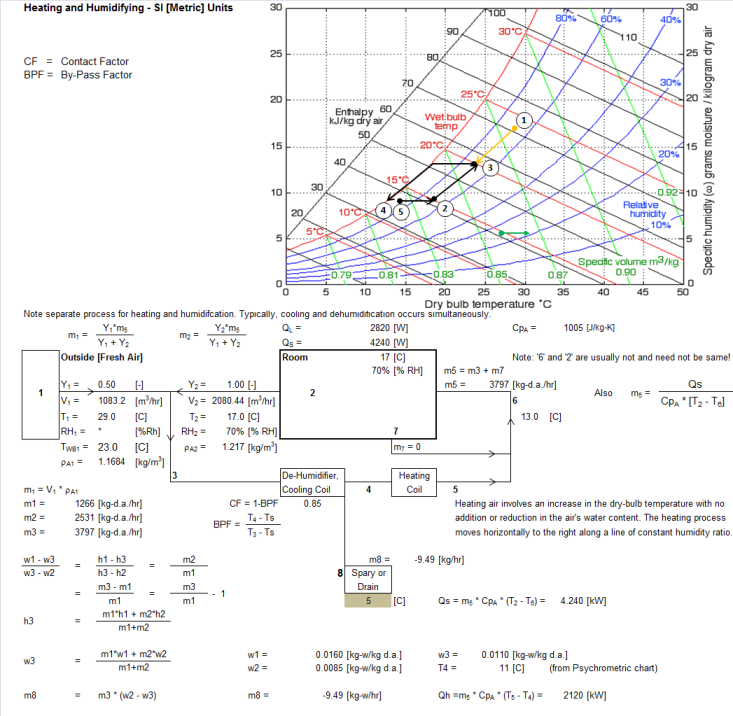
Compression Springs
The input can vary from one design conditions to other, but the overall calculation steps remain same. In this particular case, the cells highlighted in yellow were the calculated variables.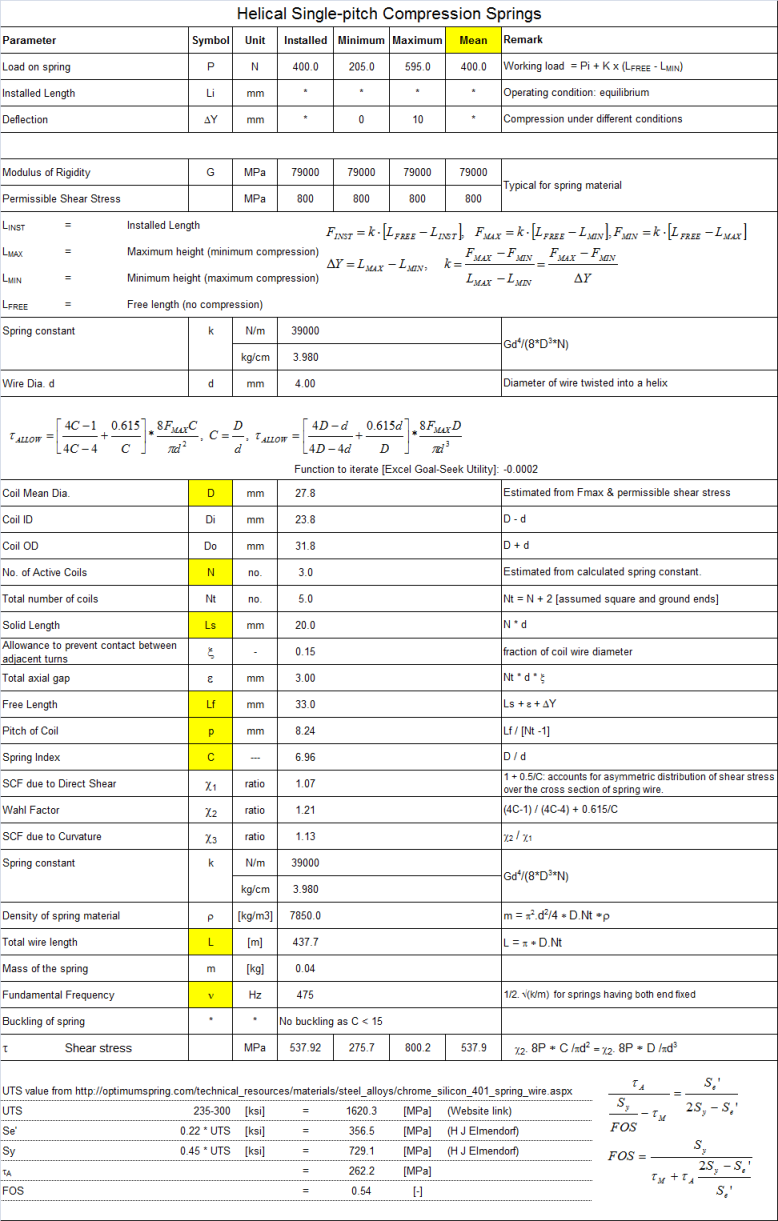
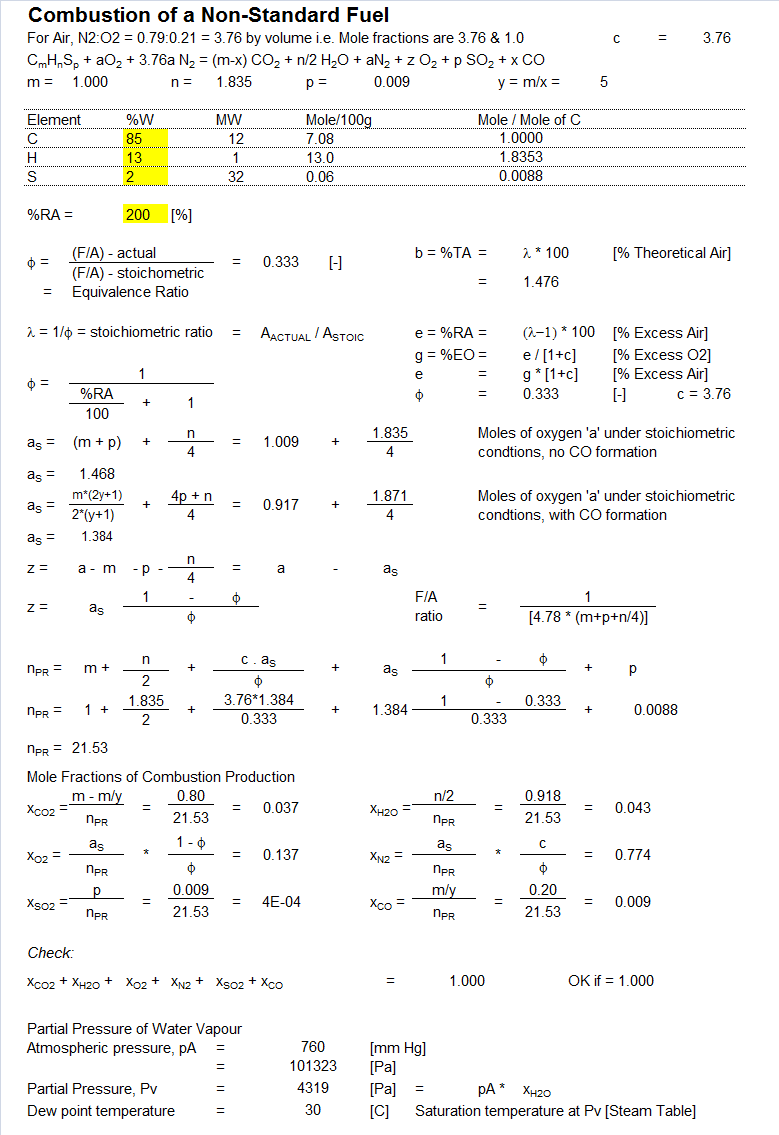
Combustion - Arbitrary Composition
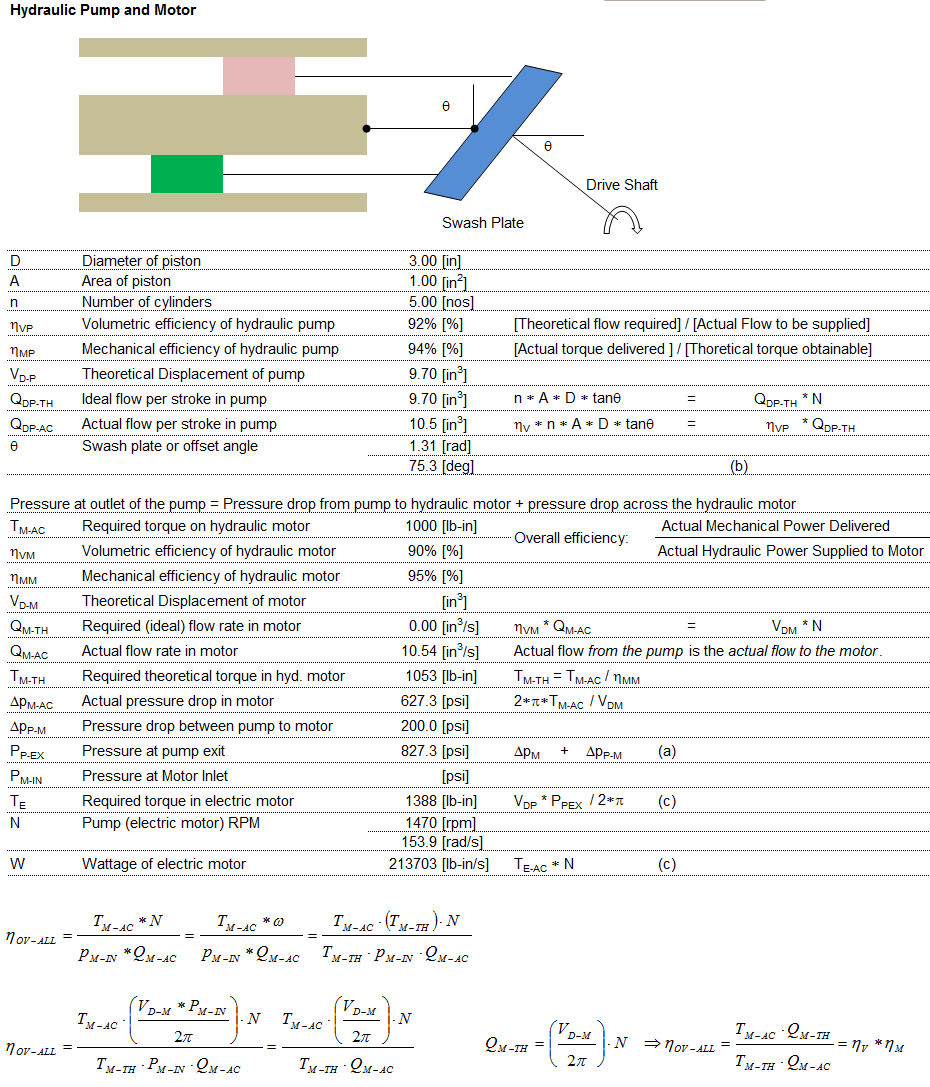
Hydraulic Drives
The content on CFDyna.com is being constantly refined and improvised with on-the-job experience, testing, and training. Examples might be simplified to improve insight into the physics and basic understanding. Linked pages, articles, references, and examples are constantly reviewed to reduce errors, but we cannot warrant full correctness of all content.
Template by OS Templates